Infographics
Deloitte
We developed a suite of charts, graphs, and visual elements to emphasize key insights, ensuring the information is accessible and engaging for the audience. This comprehensive design system was then applied seamlessly across a range of publication formats, ensuring a consistent and impactful brand experience.


Creative Process

Kick-off
Working with an established brand means strong resources, research, and clear guidelines that make consistency easier. The challenge is mastering the design language and applying it seamlessly across every medium.

Transforming Data into Stories
Editorial infographics require strong data fluency and clear visual storytelling. We turn raw information into engaging narratives that make insights easy to understand and impossible to ignore.

Final Delivery
After incorporating the client’s feedback, we fine-tune the data and design, making adjustments to every detail until the client is fully satisfied. The files are then meticulously packaged in various formats, ensuring they are optimized for digital, print, and any other intended applications.
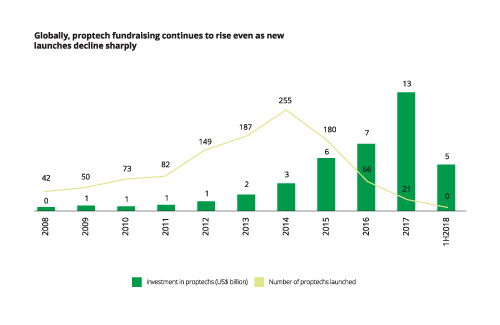
Visualize Data Across Time
Break down complicated datasets into digestible visual formats.
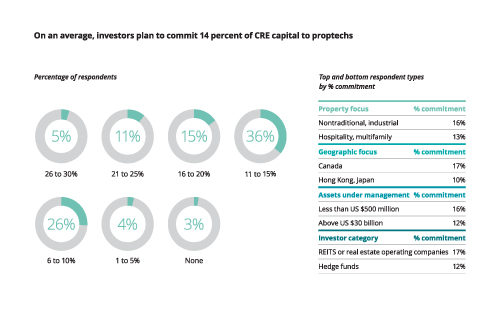
Breakdown Key Insights
Enhance comprehension by providing a visual representation of information.
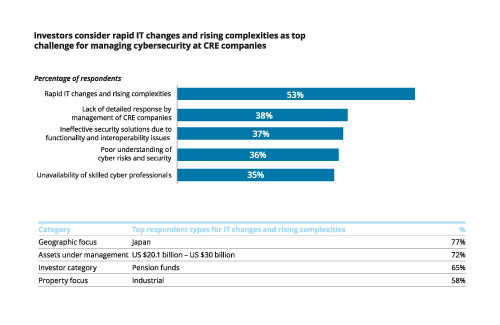
Highlight Patterns and Trends
Replace lengthy textual explanations with concise visuals for easier anaylsis.
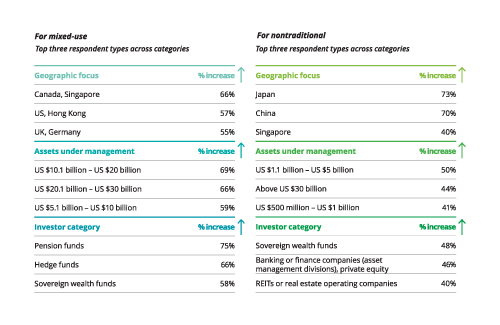
Simplify Complex Data
Enable users to quickly grasp complicated datasets at a glance.